The Setup
An IoT-powered cultivation log for mushroom growers who were flying blind.
MycoLog is a cross-platform mobile app that pairs Bluetooth and WiFi sensors with a structured grow log — turning manual clipboard tracking into continuous environmental monitoring, substrate batch histories, and harvest analytics.
Catches contamination risk before a grow is lost.
Temperature, humidity, and VPD drift out of range quietly — and by the time a grower notices, the block is already compromised. Continuous sensor readings with stage-aware thresholds surface risk while there's still time to act.
Turns a hobby notebook into a yield-tuning feedback loop.
Strain, method, and environmental data are tied to every harvest, so growers can actually see which substrates and techniques are pulling their weight instead of guessing from memory between seasons.
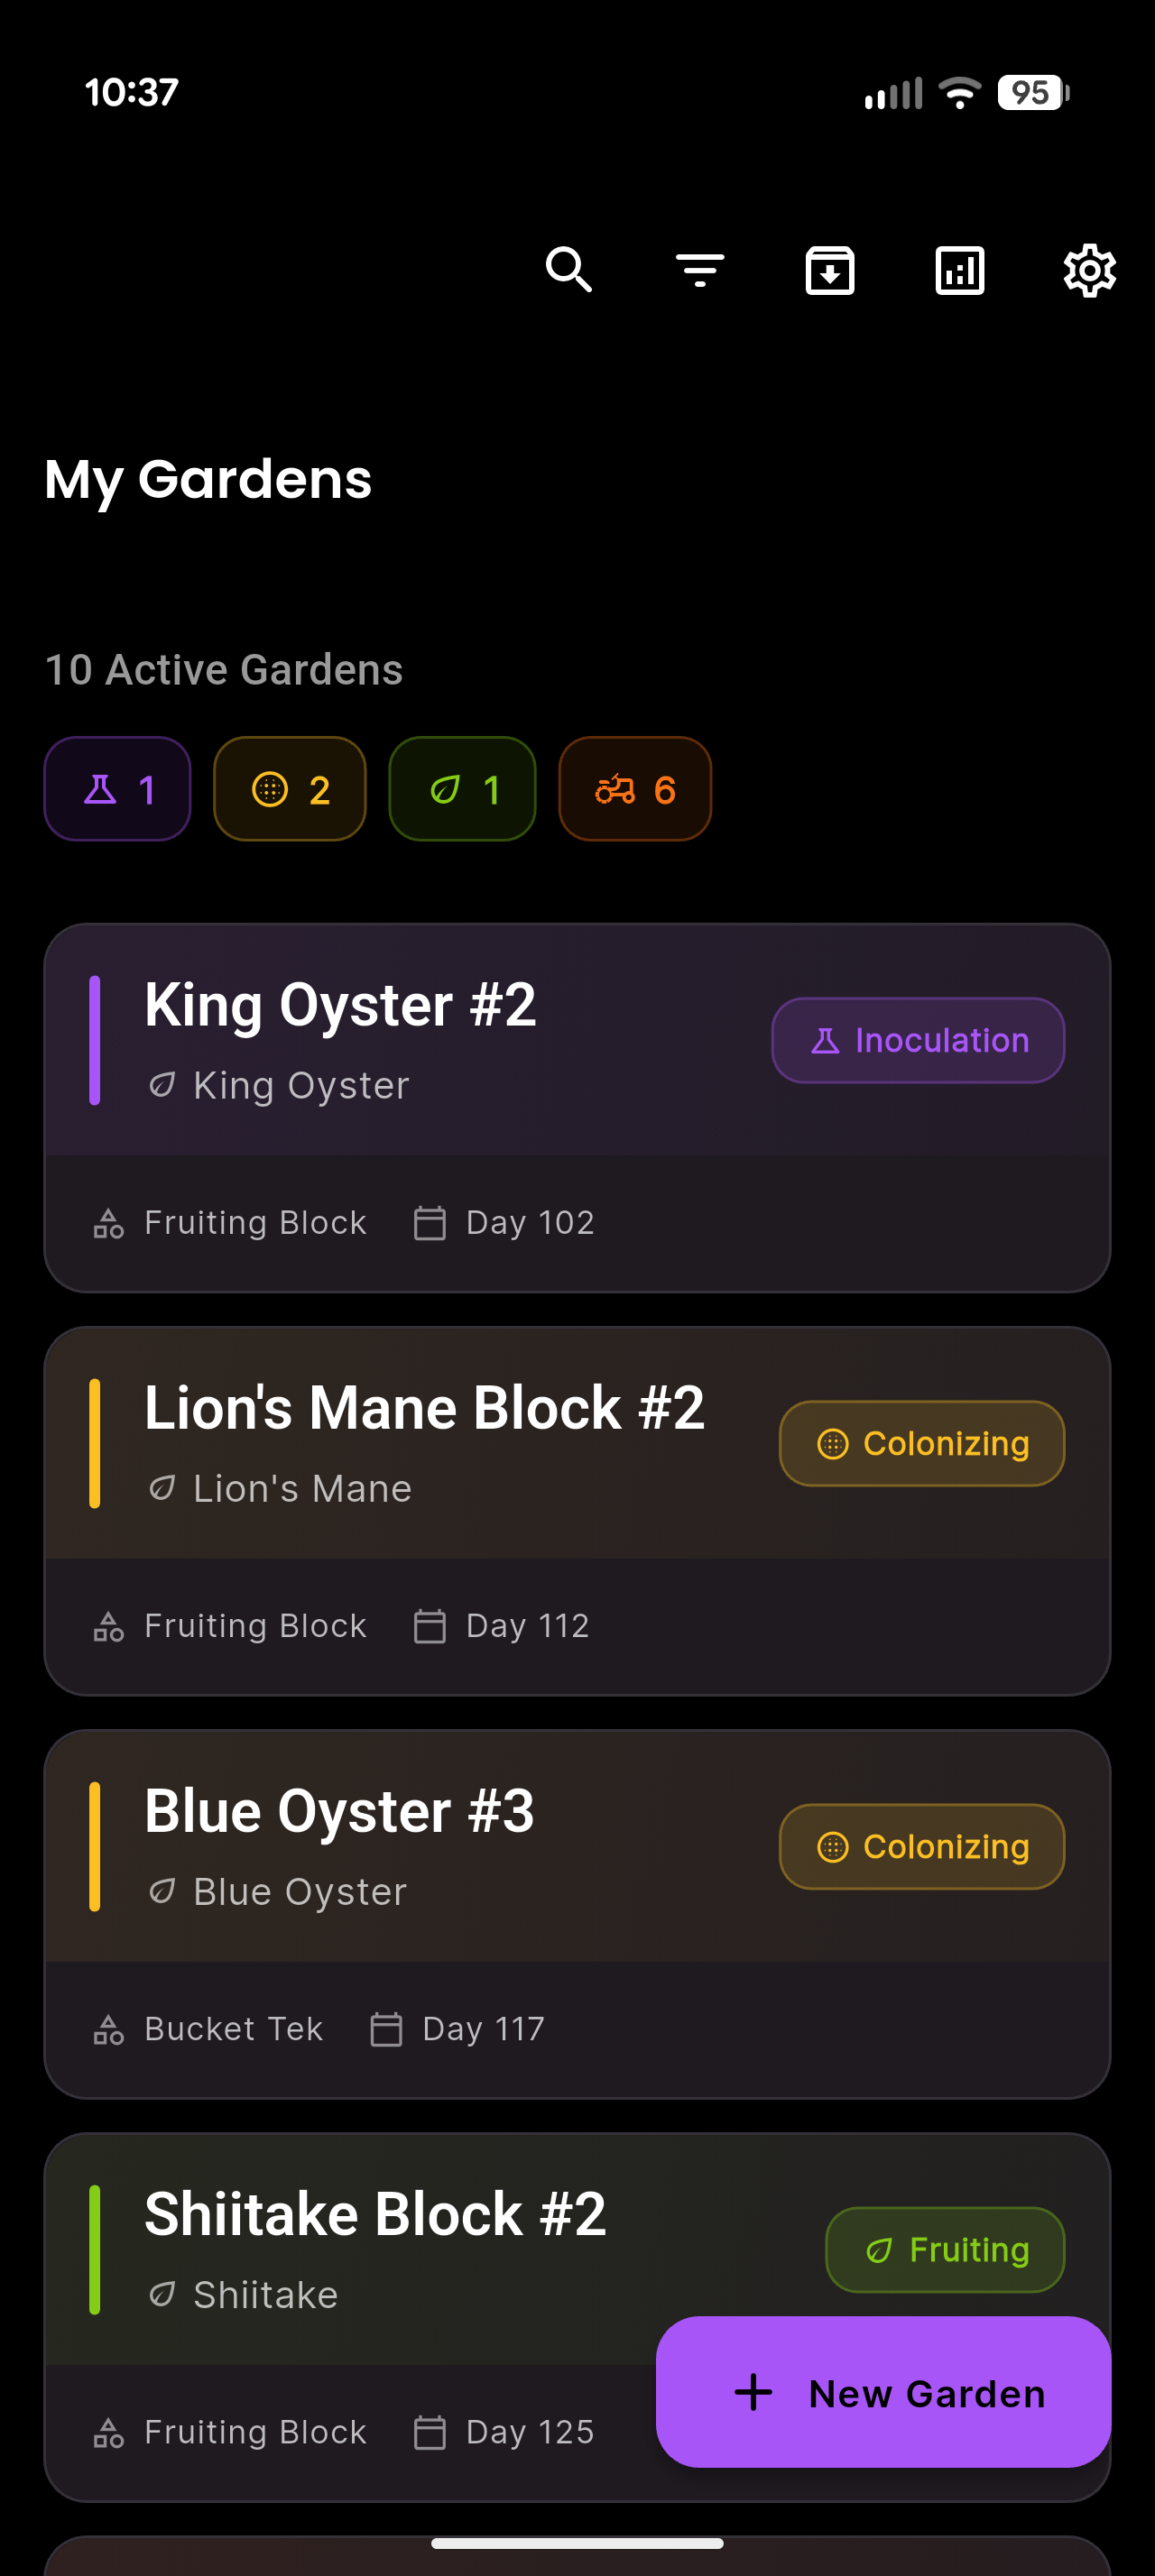
My Gardens dashboard with 10 active grows, color-coded stage badges, strain info, and day counters.
The Landscape
Precision cultivation, tracked on paper.
Mushroom cultivation demands environmental precision that most hobbyists track manually or not at all. Temperature, humidity, and CO2 levels must stay within narrow ranges that shift across growth stages — colonization, pinning, fruiting — and even small deviations can stall growth or invite contamination.
The tooling landscape was split between spreadsheets and clipboards on one side, and commercial greenhouse systems designed for industrial operations on the other. Nothing in the middle respected how a home grower actually works: across multiple substrates, strains, and methods running in parallel.
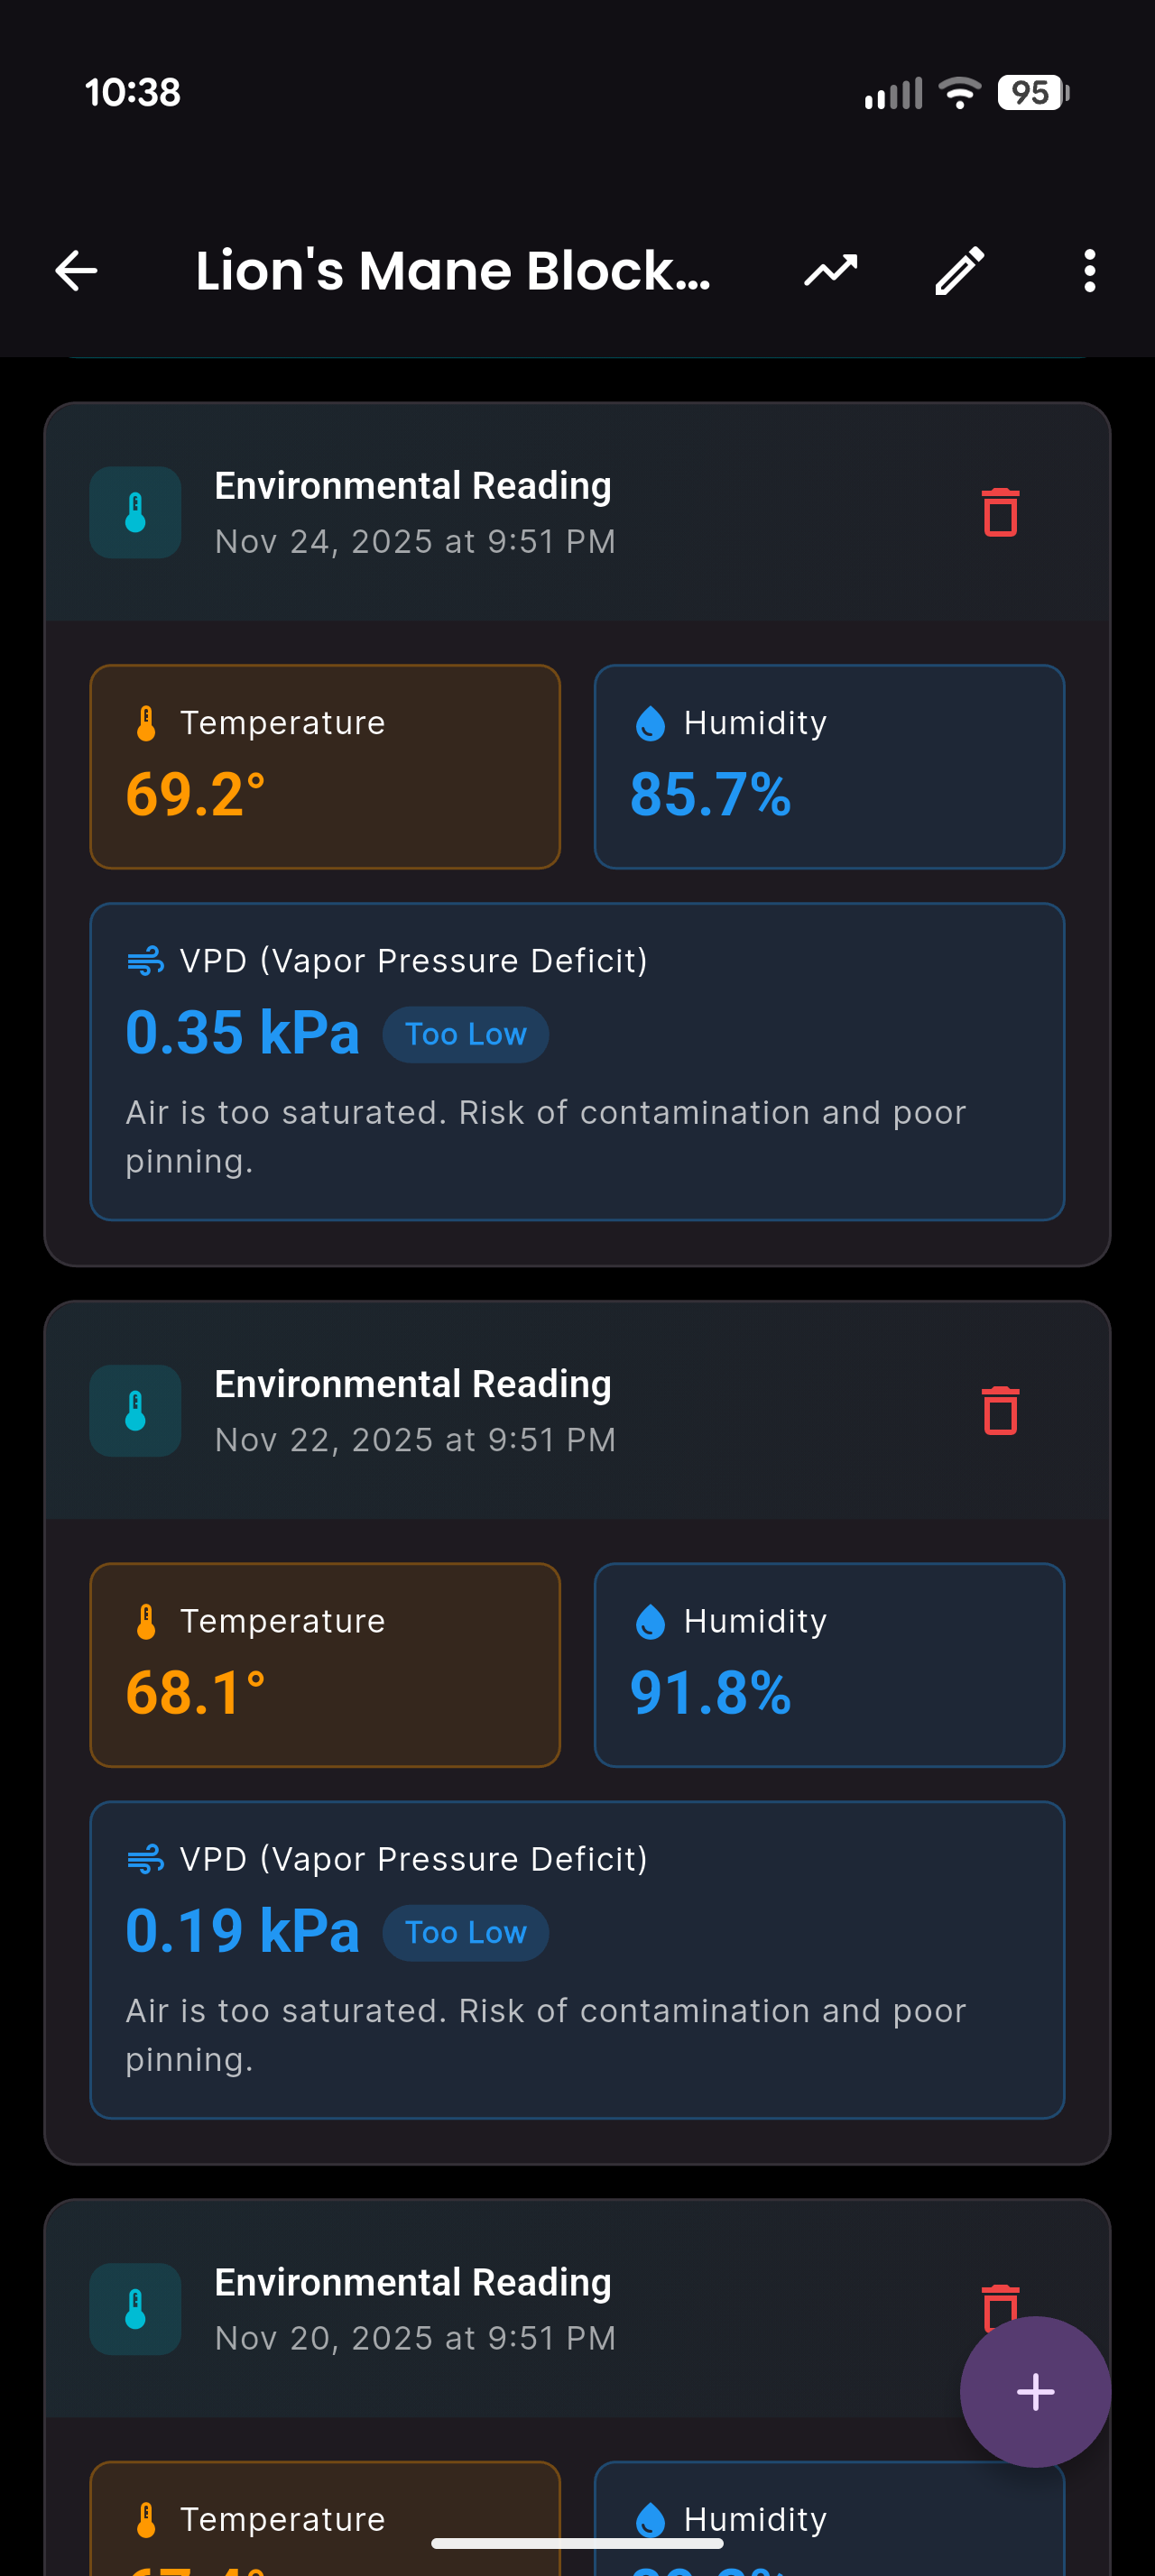
Environmental readings with temperature, humidity, VPD, and contamination risk alerts.
The Mission
Make continuous environmental data actionable, not just informational.
Build a cross-platform mobile app that pairs with affordable IoT sensors, models environmental thresholds per growth stage, and ties every reading back to a specific grow — so a home cultivator can run a dozen parallel experiments and learn from all of them.
The Moves
Four bets, ordered by risk.
A PRD that took the environmental model seriously
Started with a PRD that defined sensor integration requirements, environmental threshold models per growth stage, and the data visualization needs that would make continuous monitoring actionable. The threshold model was the hinge — without stage-aware ranges, sensor data is just noise.
Three connectivity paths, prototyped in parallel
The IoT layer was the core technical risk. Used Claude Code to prototype across BLE, WiFi, and hybrid bridge approaches in parallel, iterating through platform-specific quirks. BLE pairing behaved differently across Android and iOS, calibration routines needed hardware-specific tuning, and alert thresholds had to account for sensor noise. Each round of on-device testing fed specific observations back into the AI loop for targeted fixes.
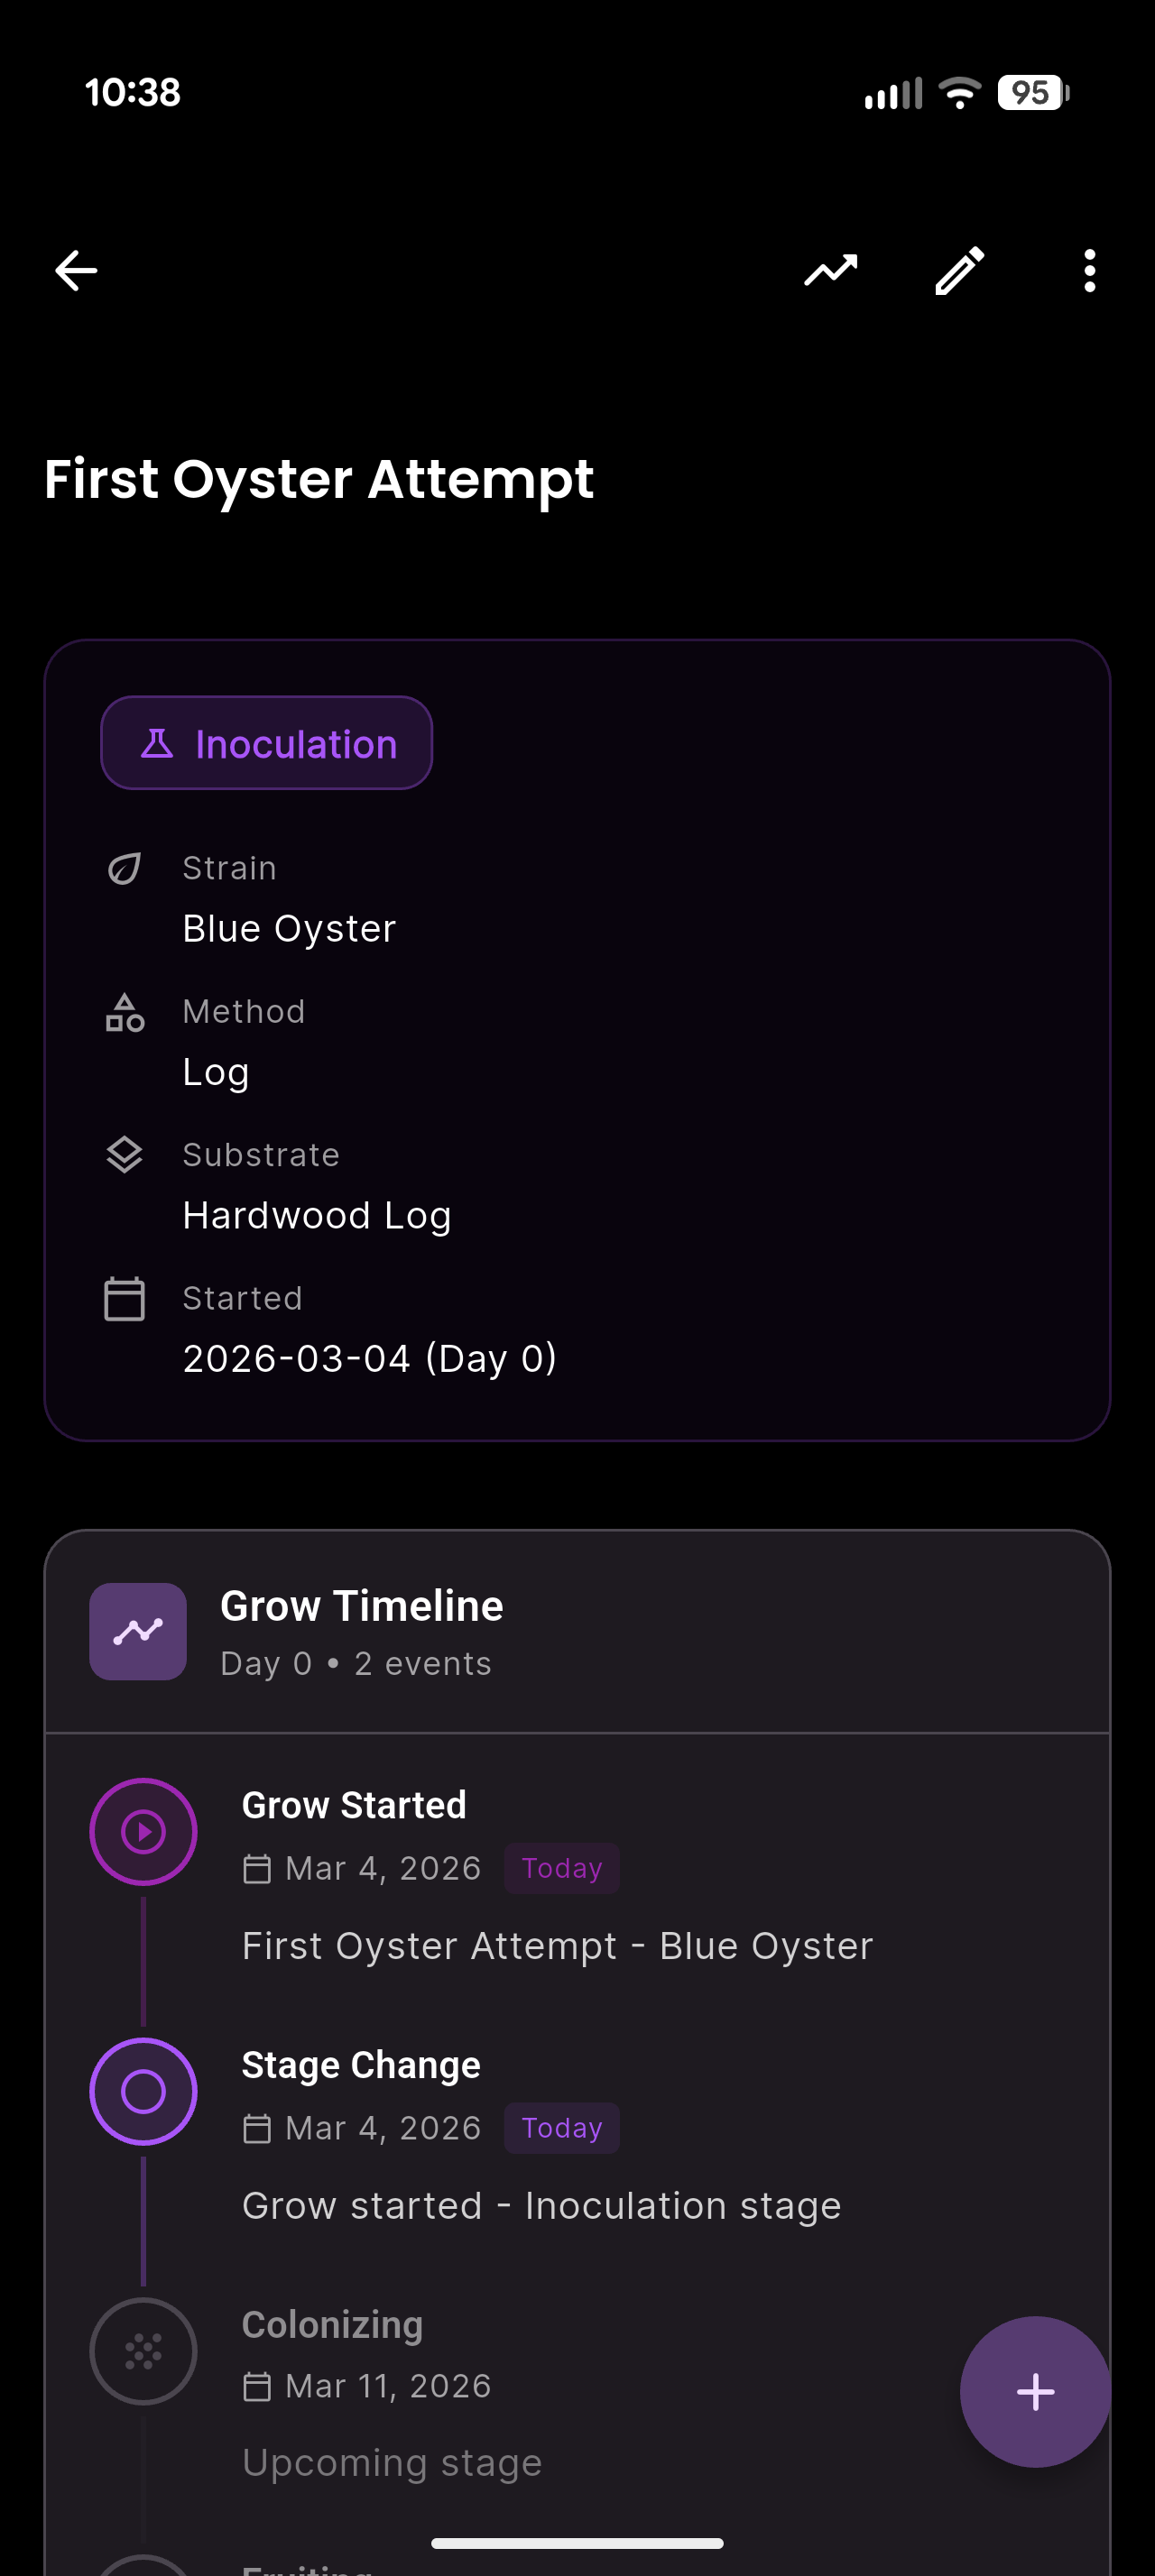
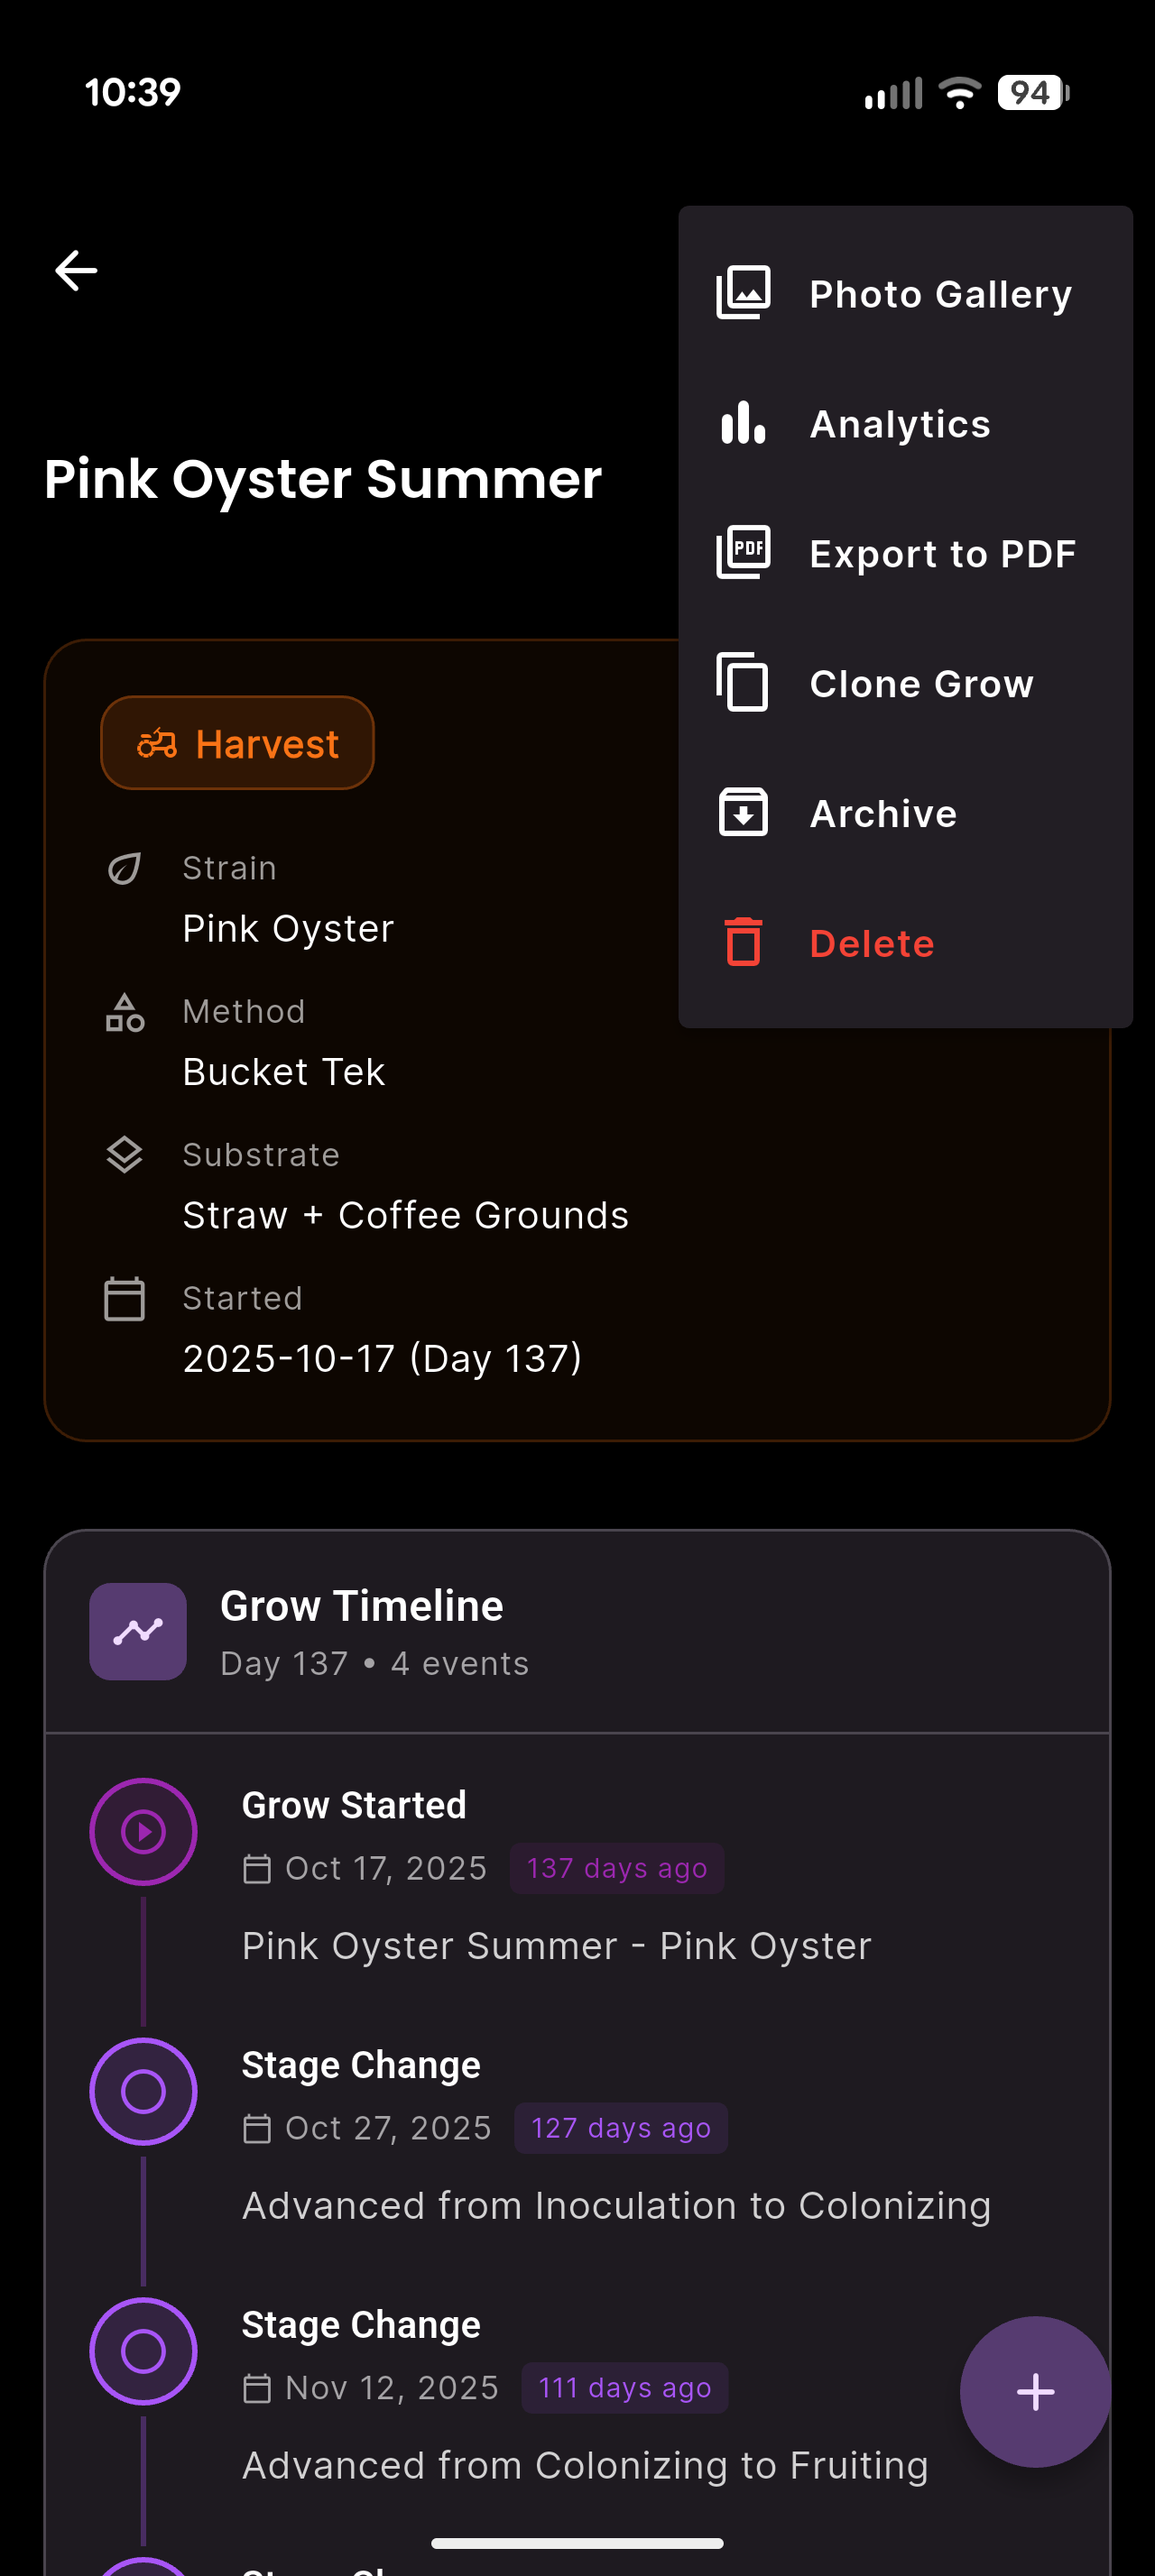
Substrate tracking from inoculation to harvest
QR-based batch tracking ties every environmental reading back to a specific substrate, from inoculation through harvest. A grow detail view collects strain, method, stage, timeline events, photos, and exports — so no single grow disappears into a drawer of notebook pages.
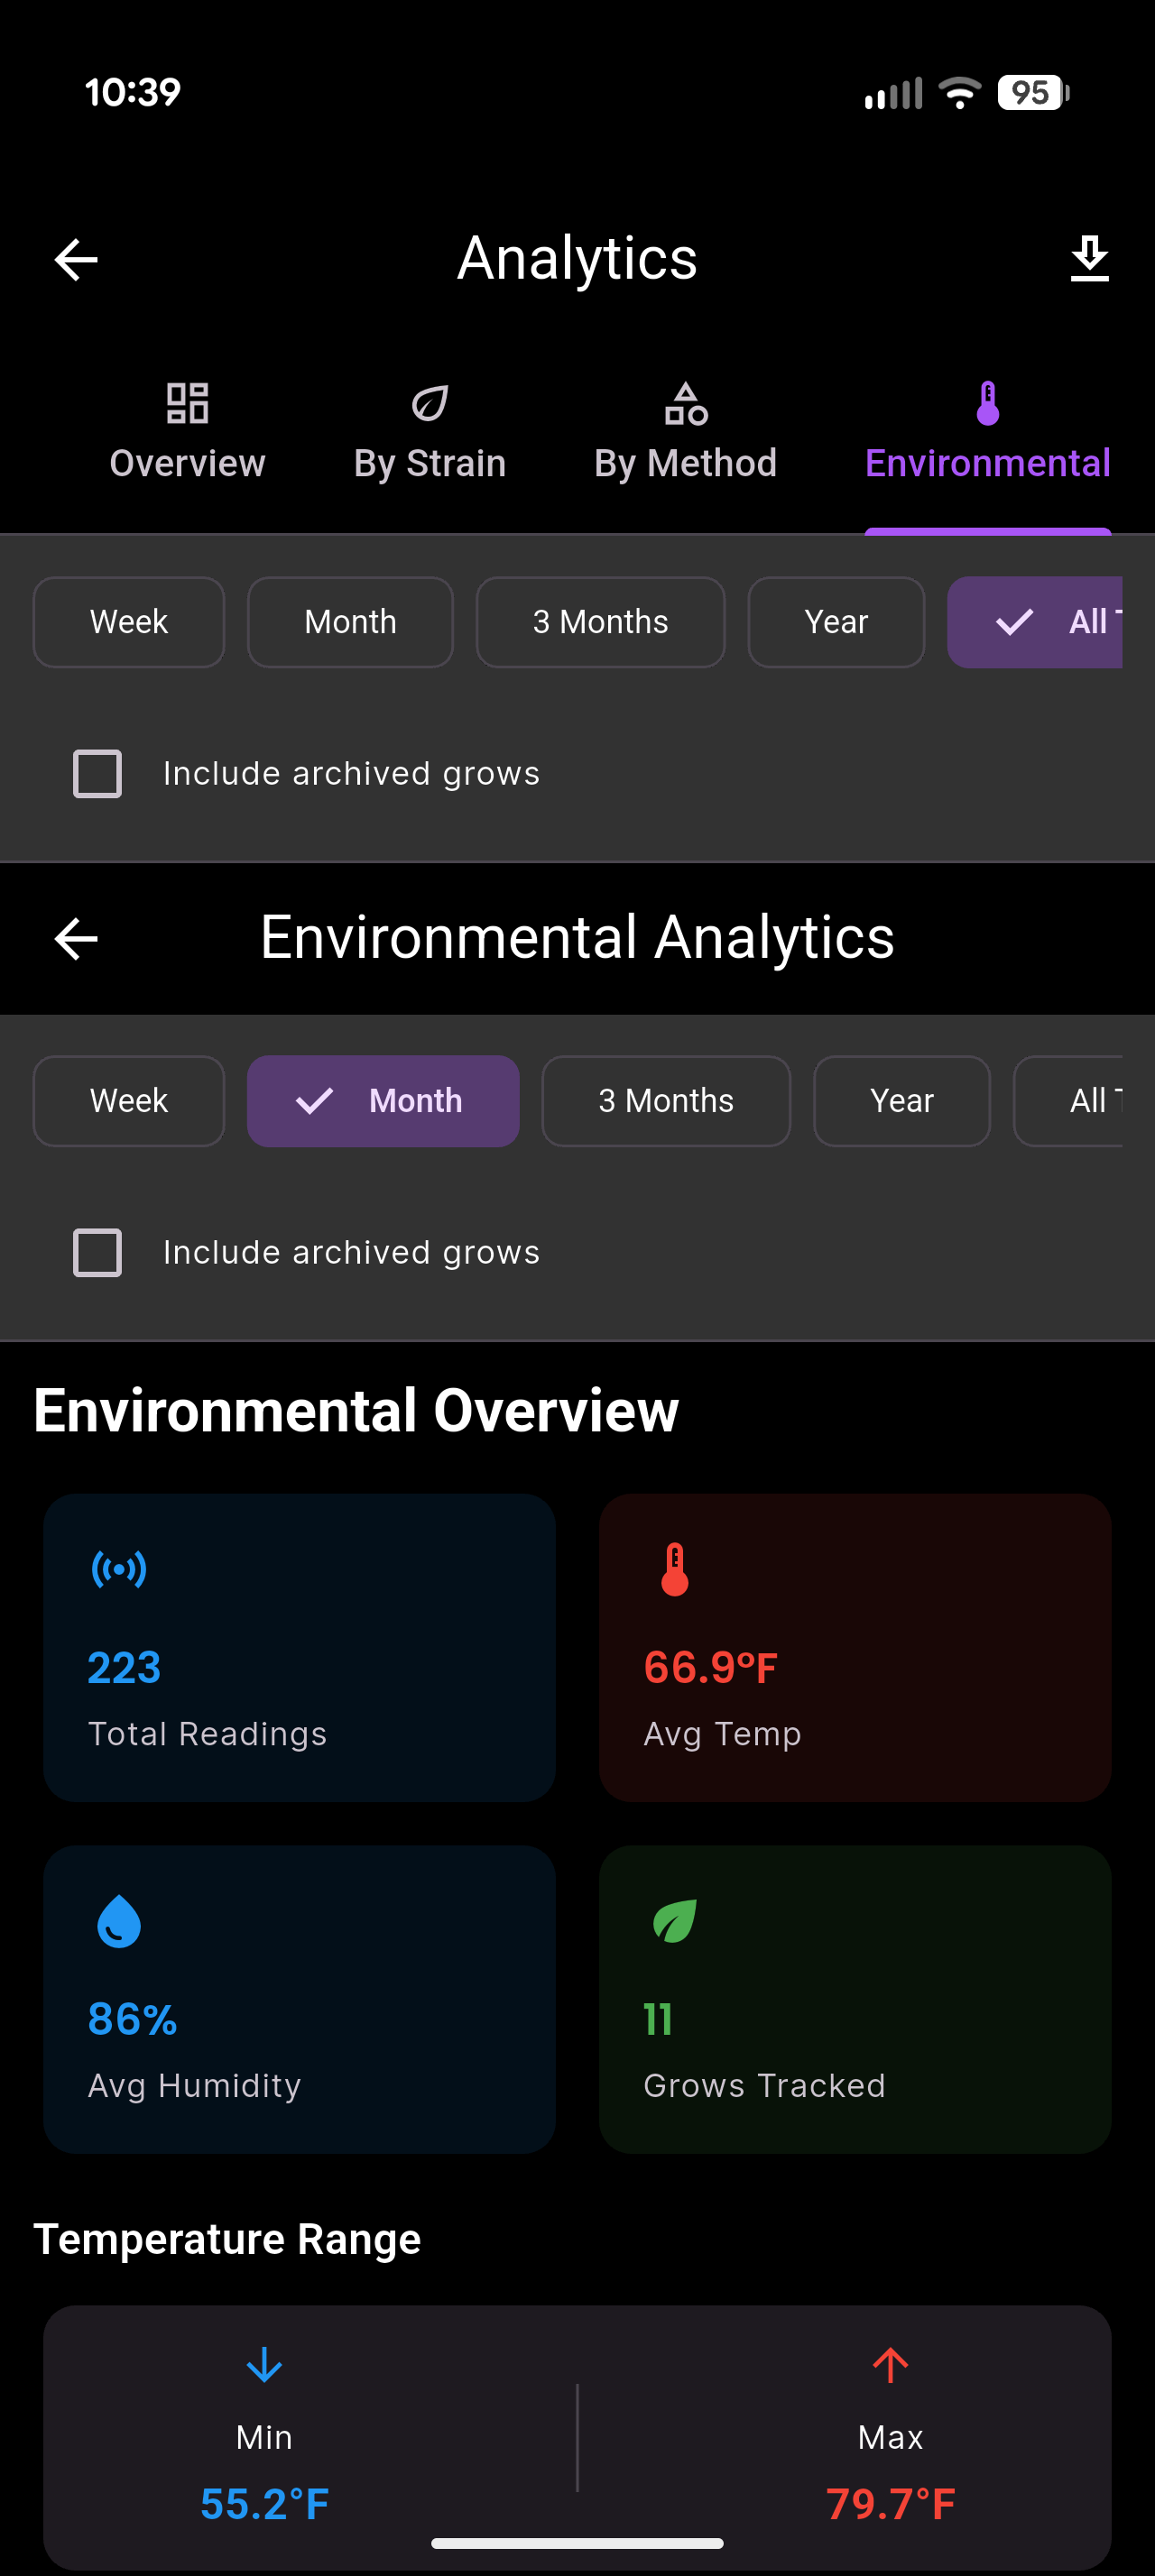
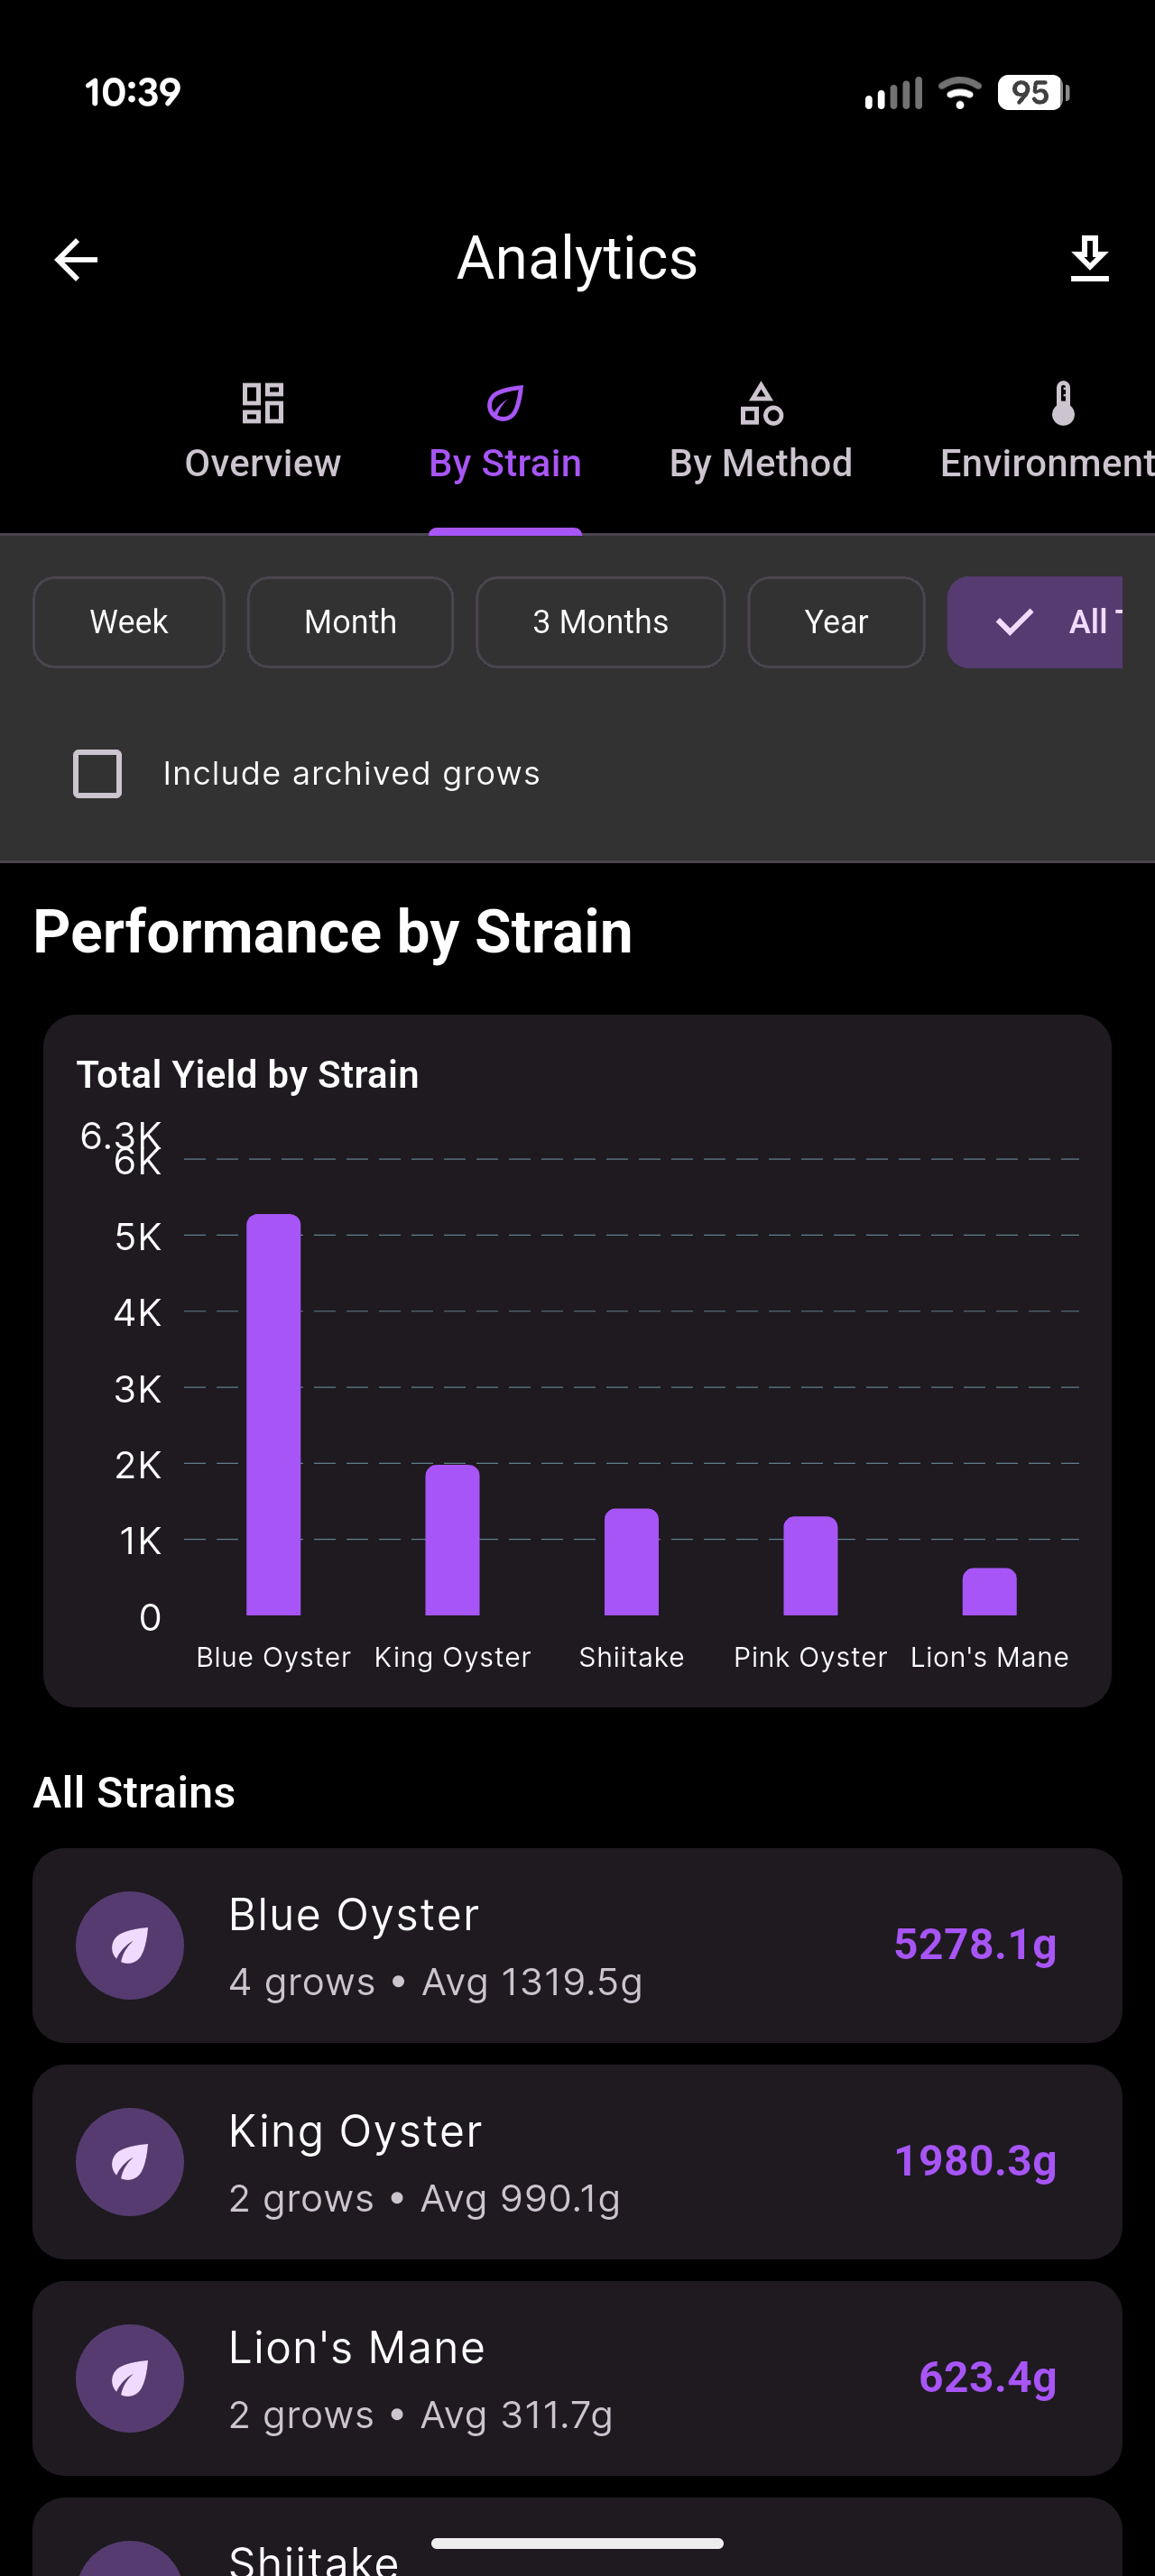
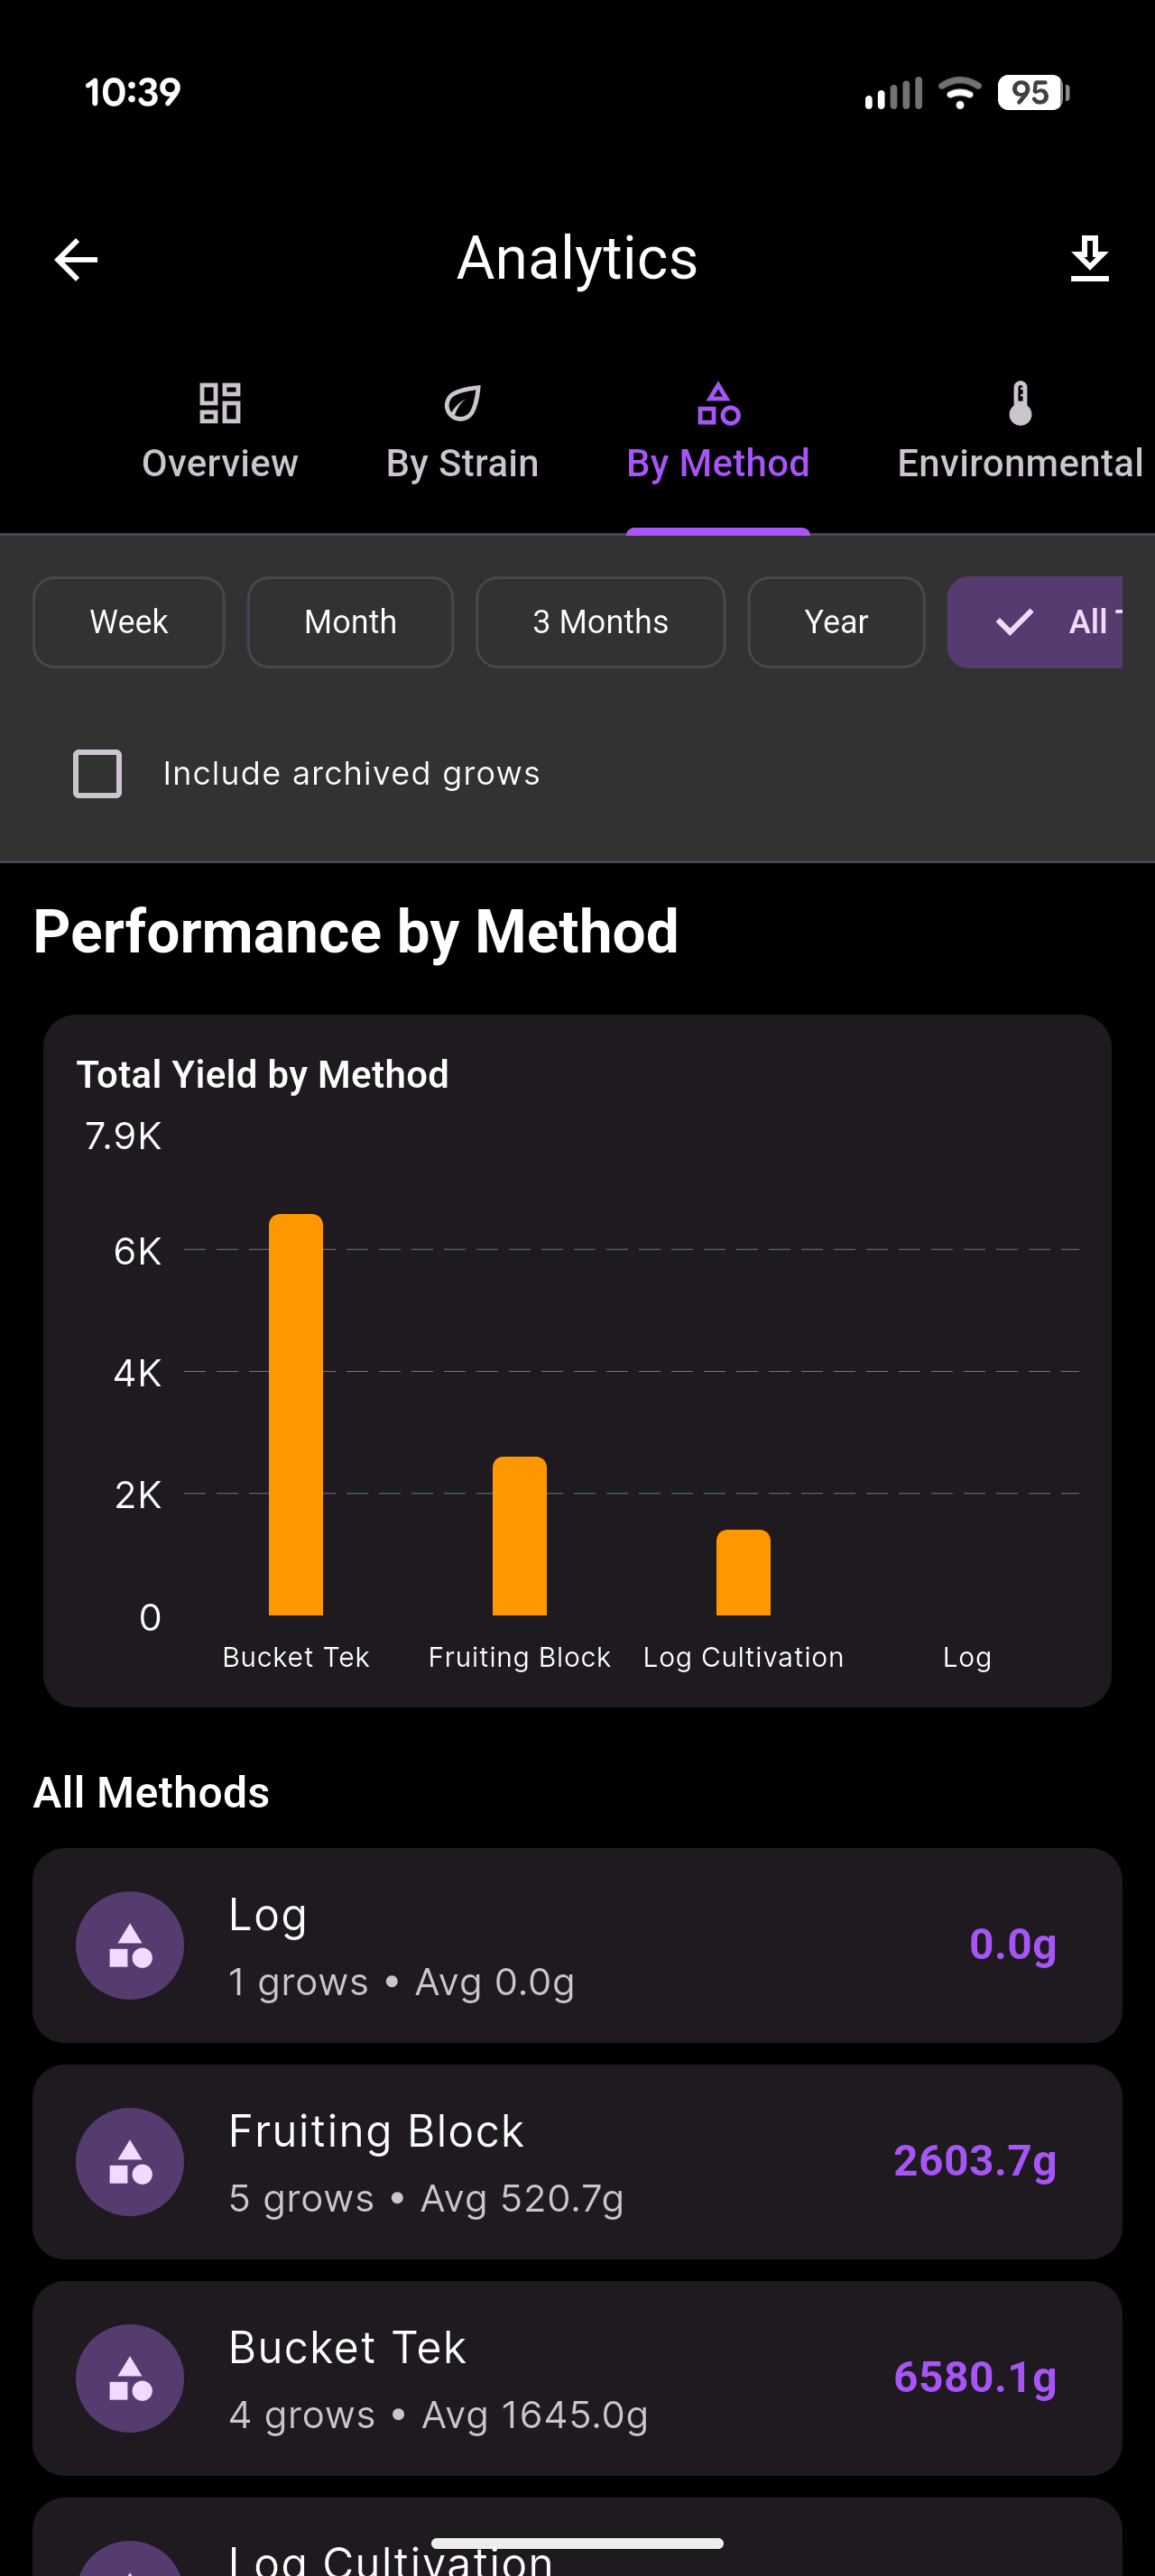
Analytics that answer the yield question
Time-series charts with threshold overlays let growers spot environmental drift at a glance. Strain and method breakdowns compare yield across experiments, so decisions about next season aren't made from memory. The whole data model is built so the most interesting question — which variable actually mattered? — has an answer.
The Payoff
A working sensor pipeline, shipping to closed testing.
MycoLog is in closed testing with real growers using real hardware. The sensor pipeline is reliable, the threshold model is catching environmental drift, and the analytics layer is already reshaping how testers think about which variables actually drive yield. Iteration continues on alert tuning and multi-room sensor reliability.
Sensor data accuracy
BLE, WiFi, and hybrid bridges
Manual logs to continuous data
Looking Back
The PRD-to-hardware-to-AI loop was the unlock.
The biggest lesson was about workflow, not mushrooms. Writing a serious PRD up front, scaffolding fast with Claude Code, then letting real-device testing drive targeted refinements let me work through IoT integration challenges that would have buried me in boilerplate otherwise. The structure is what made the speed safe.